Data is the new oil, they say. You stand to benefit from collecting as much data as you can about customer behaviors and preferences. With better data, you will be able to tailor content to individual needs and interests.
This type of data can make a huge difference with digital marketing. And data visualization is the best way to analyze and apply this data.
Why Data Visualization in Marketing?
Data visualization presents information in a way that is easier to comprehend. With this tool in hand, marketers can then make better decisions about their campaigns.
For example, you can represent complex statistical data with fewer numbers. Simply use their visual equivalents.
Marketers frequently struggle to make sense of large amounts of multi-dimensional data. Without an effective way to compare different groups and clusters, they often find it impossible to extract any valuable insights from this data.
With data visualization, marketers obtain more actionable information about their target audience. And with this improved data interpretation, they are able to develop more effective strategies and campaigns.
For example, a marketer may want to know which social media platforms their target demographic prefers to use. He or she can use data visualizations to easily understand the percentage of users on different platforms.
Data visualization is an ideal way to summarize and simplify large volumes of information.
Marketers use visualization as a foundation for further analysis and interpretation. They can then uncover hidden connections between different ideas, trends, and other pieces of data.
Without a simplified visualization to summarize all of these data points, many marketers will completely overlook this types of insight.
How To Improve Digital Marketing Campaigns With Data Visualization
Companies that was to succeed will most likely pick the best possible digital marketing strategies. With careful planning, creativity, and an interactive approach to communications, these companies will maximize their likelihood of success.
Data visualization is of significant value to marketers. But how can they use it to improve their digital marketing campaigns?
Let’s review some of the top insights you as a marketer can glean from data visualization and analysis.
Understand Behavioral Trends For Your Target Audience
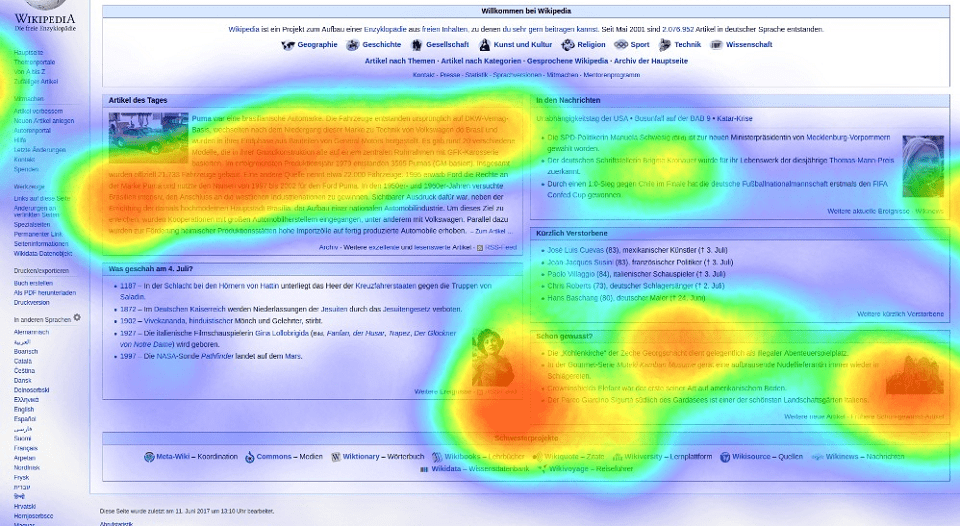
You can analyze website traffic or engagement on social media with a number of data visualization types, such as heat maps, scatter plots, etc.
This type of analysis is pretty simple. With it, you can gain valuable insights into what content is the most popular with your customers and how they behave on different online platforms.
But even more importantly, this knowledge can help you better define your customer in the first place. You can describe them in great detail based on behaviors and preferences alone. These are key input points when generating buyer personas.
For example, let’s suppose your customers buy more products after watching a video, rather than after they read a written post on your blog. In this case, you can conclude that video marketing works better for your target audience.
Your website traffic data may also indicate which other websites are popular among your customers, as well as how frequently they visit these domains.
With this information, you can increase your own organic traffic by building links on those websites or optimizing for keywords they omit from their own content. You can also better execute a social media marketing campaign or partner with those website owners on outbound efforts.
Conduct Competitive Analysis
If you want to maximize the return on your digital marketing efforts, you need to know in detail what your competitors are doing.
Use data visualization to better understand their strengths and weaknesses. It will also help you identify the most likely areas where you can improve business performance.
In this way, you have a chance to improve upon the existing strategies and eventually get ahead of the competition. Data visualization helps you better understand your market and create winning strategies to succeed in your niche.
Keep Track of Behavior Changes Within Your Target Audience
Data visualizations can also help you keep tabs on changes to your audiences behaviors or preferences.
While analyzing your data, perhaps you might notice a considerable increase in the number of customers from a specific demographic group.
You can use data visualization to ascertain whether or not this is a temporary shift. And if it is permanent, you can get a better understanding on which of your product(s) they prefer.
Learn More From Market Research
Data visualization is a great way to understand your customers better. You can use it for market research purposes or to study the market in general.
In this way, marketers get a chance to understand their target audience, find out what kind of products they need, and learn what other services they might want from your company. This can all be pulled directly from data you have collected.

Marketing campaigns are not the only activities where you can use data visualization. You can also use it for product design, manufacturing processes improvement, and many other areas of business operations.
Be sure you understand what types of data tools are available to you. You can use them in many areas above and beyond marketing campaigns alone.
Segment Your Customers Better
If you want to succeed at digital marketing, you need to master segmentation. This is how you learn who your customers are, what their wants and needs are, and how they behave online.
With this information at your disposal, you’ll be able to message and market to them the right way. The way THEY want you to approach them.
Improve Keyword Research
You can’t even start to talk about digital marketing without taking keywords into consideration. It’s one of the biggest factors for succeeding.
When you better understand the right keywords your target audience searches for, you can then optimize your content to satisfy both them and the search engines.
Using data visualization, you can identify the keywords and topic clusters that will gain you the attention you desire. Good keywords are a must. Use every tool you can to identify them.
Evaluate Website Traffic
With data visualization, you can evaluate your website traffic in greater detail. This should help you figure out what parts of the website need improvement, and what types of content resonate best with visitors.
You want an engaging website that drives leads. Data can help you achieve that vision.
Improve Inbound Marketing Campaigns
Inbound marketing is a challenging area for marketers. Why? Because you have to put in a lot of time and effort to set up the entire machine, and then let customer come to you.
This is where planning and creativity become crucial. And to get it right, you can again turn to data visualization.
The right analysis will help you figure out which channels are driving engagement and leads. It will also help you figure out what parts of those channels are working the best.
With this depth of knowledge, you can focus on improving areas that aren’t working as expected. In the end, you’ll improve your campaign ROI over time.
Optimize Form Design
Do you know the response / completion rate for all of your online forms? You should.
With the right data overlay, you can improve your overall funnel and drive more leads.
Some thing to look at could be:
- Overall design of the forms
- Number of fields required and/or optional
- Placement of the form on the page
- Font usage within the form itself as well as the CTA
- Button colors and messaging
All of these variables can make or break your completion rate. Use data visualization to identify which needs attention so you can show improvement over time.
Customer Surveys
Online surveys results in mounds of data that need to be sifted through for you to understand the findings.
Data visualization is a great way to boil all of that data down into a clean, easy to understand visual format. You can use this tool to greatly shorten the analysis time, and start making improvements sooner.
Of course, as with web forms, you can use these insights to improve the completion rate, design, etc. for the survey itself.
How Can Data Visualization Help With Customer Support?
Customer support is another area where data visualization can be a big help. You can use it to analyze incoming customer requests, to determine what kind of issues they have, and to understand how often these problems arise.
You will also be able to determine how customer prefer to contact you (phone, email, web form, etc.).
With all of this information, you can optimize your support processes and best understand the customer base separately from the overall target audience.
Data visualization will help you process customer ticket data and determine whether or not your team needs to spend more time on training.
Consider creating Sankey charts. These charts will illustrate how many cases each agent handles and what issues need more attention from the customer support team.
How to Use Data Visualization to Track Sales Processes
You can also use data visualization to get detailed information about the various customer purchase processes. This data will help you decide where you need to make changes or incremental improvements to each separate buying process.
For example, you stand to lose sales if the sales funnel process is too time consuming.
With visualization, you can figure out where people are abandoning the purchase (e.g. abandoning the ecommerce shopping cart) and why they do it.
Use data visualization to find a solution for this issue. Afterward, you’ll enjoy better conversion rates, improved sales numbers, and more satisfied customers.
Conclusion
The above examples show the many ways that data visualization can be used to improve your work as a marketer, customer support manager, or sales manager.
This technique will help you do your job better by analyzing customer feedback, predicting future trends, and handling incoming customer requests.
And finally, it will help you achieve your business goals much quicker than with traditional marketing techniques.
All images provided by the author under his or her own license.
Disclaimer: The views and opinions stated in this post are that of the author, and Return On Now may or may not agree with any or all of the commentary.
This guest post brought to you courtesy of Return On Now, Professional Austin SEO and PPC Services Company.
Ryan Erwin
Latest posts by Ryan Erwin (see all)
- Ultimate Guide to eCommerce Competitor Analysis - October 4, 2022
- Data Visualization: Using It To Improve Digital Marketing Campaigns - January 25, 2022


