Welcome to this guest post about heatmaps.
Many digital marketers are trying out a variety of new tools to see what has the biggest positive impact on their website and conversion rate.
Every owner wants to know if their site’s architecture and design are giving them the best results.
Is the website getting visitors to take actions that lead to conversion.
One of the popular methods of benchmarking website success is heatmapping.
If you’re a webmaster and you’ve wondered about a new way to optimize your site, I recommend you learn about heatmap tools and give some a test run yourself.
What are Heatmaps?
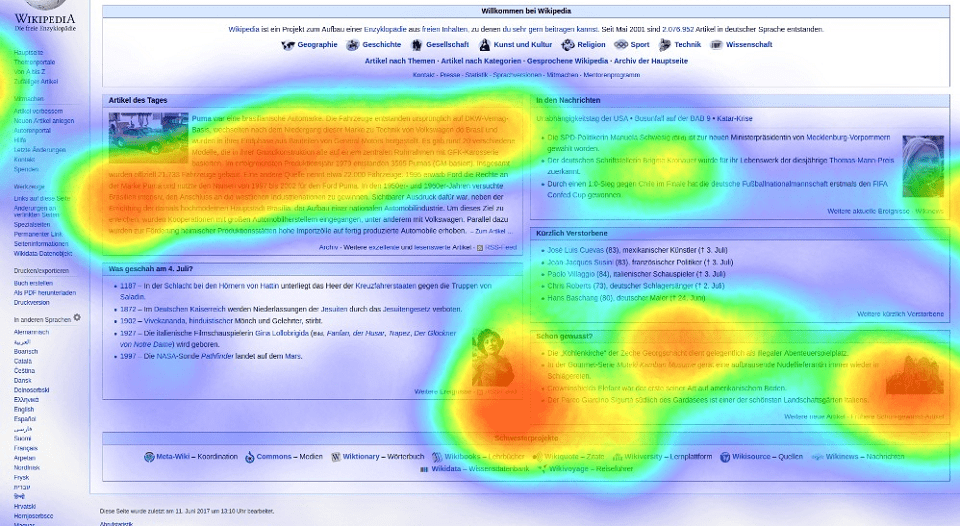
Heat mapping software shows marketers where people are clicking on a page.
It enables users to see what actions visitors are actually taking and where the most engagement is happening.
Here are some of the basic types of heat maps:
Attention / Eye tracking maps
These maps identify where users are looking, what parts of the page they are reading and what takes most of their attention.
It’s more complex to set up and more expensive to run the tests due to the technology and software involved.
These heatmaps can only be conducted within the structure of a focus group.
Mouse movement heatmaps
These heatmaps illustrate patterns when users are navigating and reading a page.
They can also indicate how many visitors hover over a particular area of a page, so you can see which part commands the most attention.
Click maps
As the name suggests, these kind of maps show where users click the most on the page.
By using these heatmaps, you can clean out distracting links and direct attention to the calls-to-action, which is critical to conversion.
Scroll maps
These maps show the point at which visitors abandon a page as they scroll through it.
Using information from these maps, you can determine the new length of your content and where to place your critical calls-to-action(s).
This is a great way to maximize the effectiveness of your pages.
How can heat maps help?
By studying these heatmaps, you can learn a lot about your users’ behaviors.
If you know what they focus on the most, how they react to your call-to-action and whether they’re navigating the website the way you intend them to, you can make use of that information in order to better optimize your website.
You can find out:
- What’s working and what isn’t on the page
- Whether some items on the page should be made into clickable elements
- Which parts of the page are distracting
- Where you should position the key information for maximum visibility
Instead of speculating how a certain user experience design or graphic layout would work for your website, you can test and tweak in real-time to maximize results.
Using heat maps can be rather intuitive and easy.
It shouldn’t come as a problem to identify which parts should be fixed and which shouldn’t.
Heatmaps are incredibly inexpensive to make – that’s a huge plus.
Back in the day, you’d have to gather a large number of people and spend a sizable budget on focus groups to obtain the data they provide.
Some data might even be misleading.
Focus groups of participants tend to change their behavior when under observation.
Heat mapping isn’t prone to be affected in that way at all.
The data is more accurate, representing a large set of users that are most likely to be your ideal clients or customers.
How does this increase conversions?
The end goal of every call-to-action on your website is for your visitors to click on a button, whether it be to subscribe, add to cart, checkout, etc.
Experts from Websitesthatsell Brisbane advise webmasters to use heat mapping to can get to know their website’s structure and page design.
Then, they can optimize it in order to reach that goal.
By using heat maps, you can assess the effectiveness of your call-to-action and make adjustments: placement, copy of the button, and the overall design for maximizing conversion rates.
It’s not all about call-to-action, though. Not all conversions are preceded by user clicking on a CTA.
For example, someone might read some copy about a sale, and and then browse products on the same page.
They did not have to click on anything, but the copy has still achieved the goal.
Most Internet users are savvy enough to scroll (and therefore to leave), which is no longer a big factor in page design.
That said, scroll map studies show that it still has an impact on whether your content is being seen.
Use information from scroll maps to understand where your visitors tend to abandon pages.
You can also see if your calls-to-action are placed above the point where most users leave the pages, and then adjust page length for maximum effectiveness.
Conclusion
There are various tools you can use to generate heatmaps.
With these tools, you can gain insight into how users interact with your website and understand how you can maximize your conversion by optimizing:
- Page layout
- Content length
- Calls-to-action
- Other aspects of your website
It may take some time to see the results, but in the long run, it’s the smart thing to do.
All Images provided by the author under his or her own license.
Disclaimer: The views and opinions stated in this post are that of the author, and Return On Now may or may not agree with any or all of the commentary.
Updated October 29, 2025
Sam Cyrus
Latest posts by Sam Cyrus (see all)
- Using Heatmaps to Increase Website Conversion Rate - September 14, 2017
- Essential Design Aspects for eCommerce Websites - May 30, 2017
- How to Create High Quality Landing Pages that Convert - January 17, 2017


